First connection
Once dblumi is running, connect it to your database.
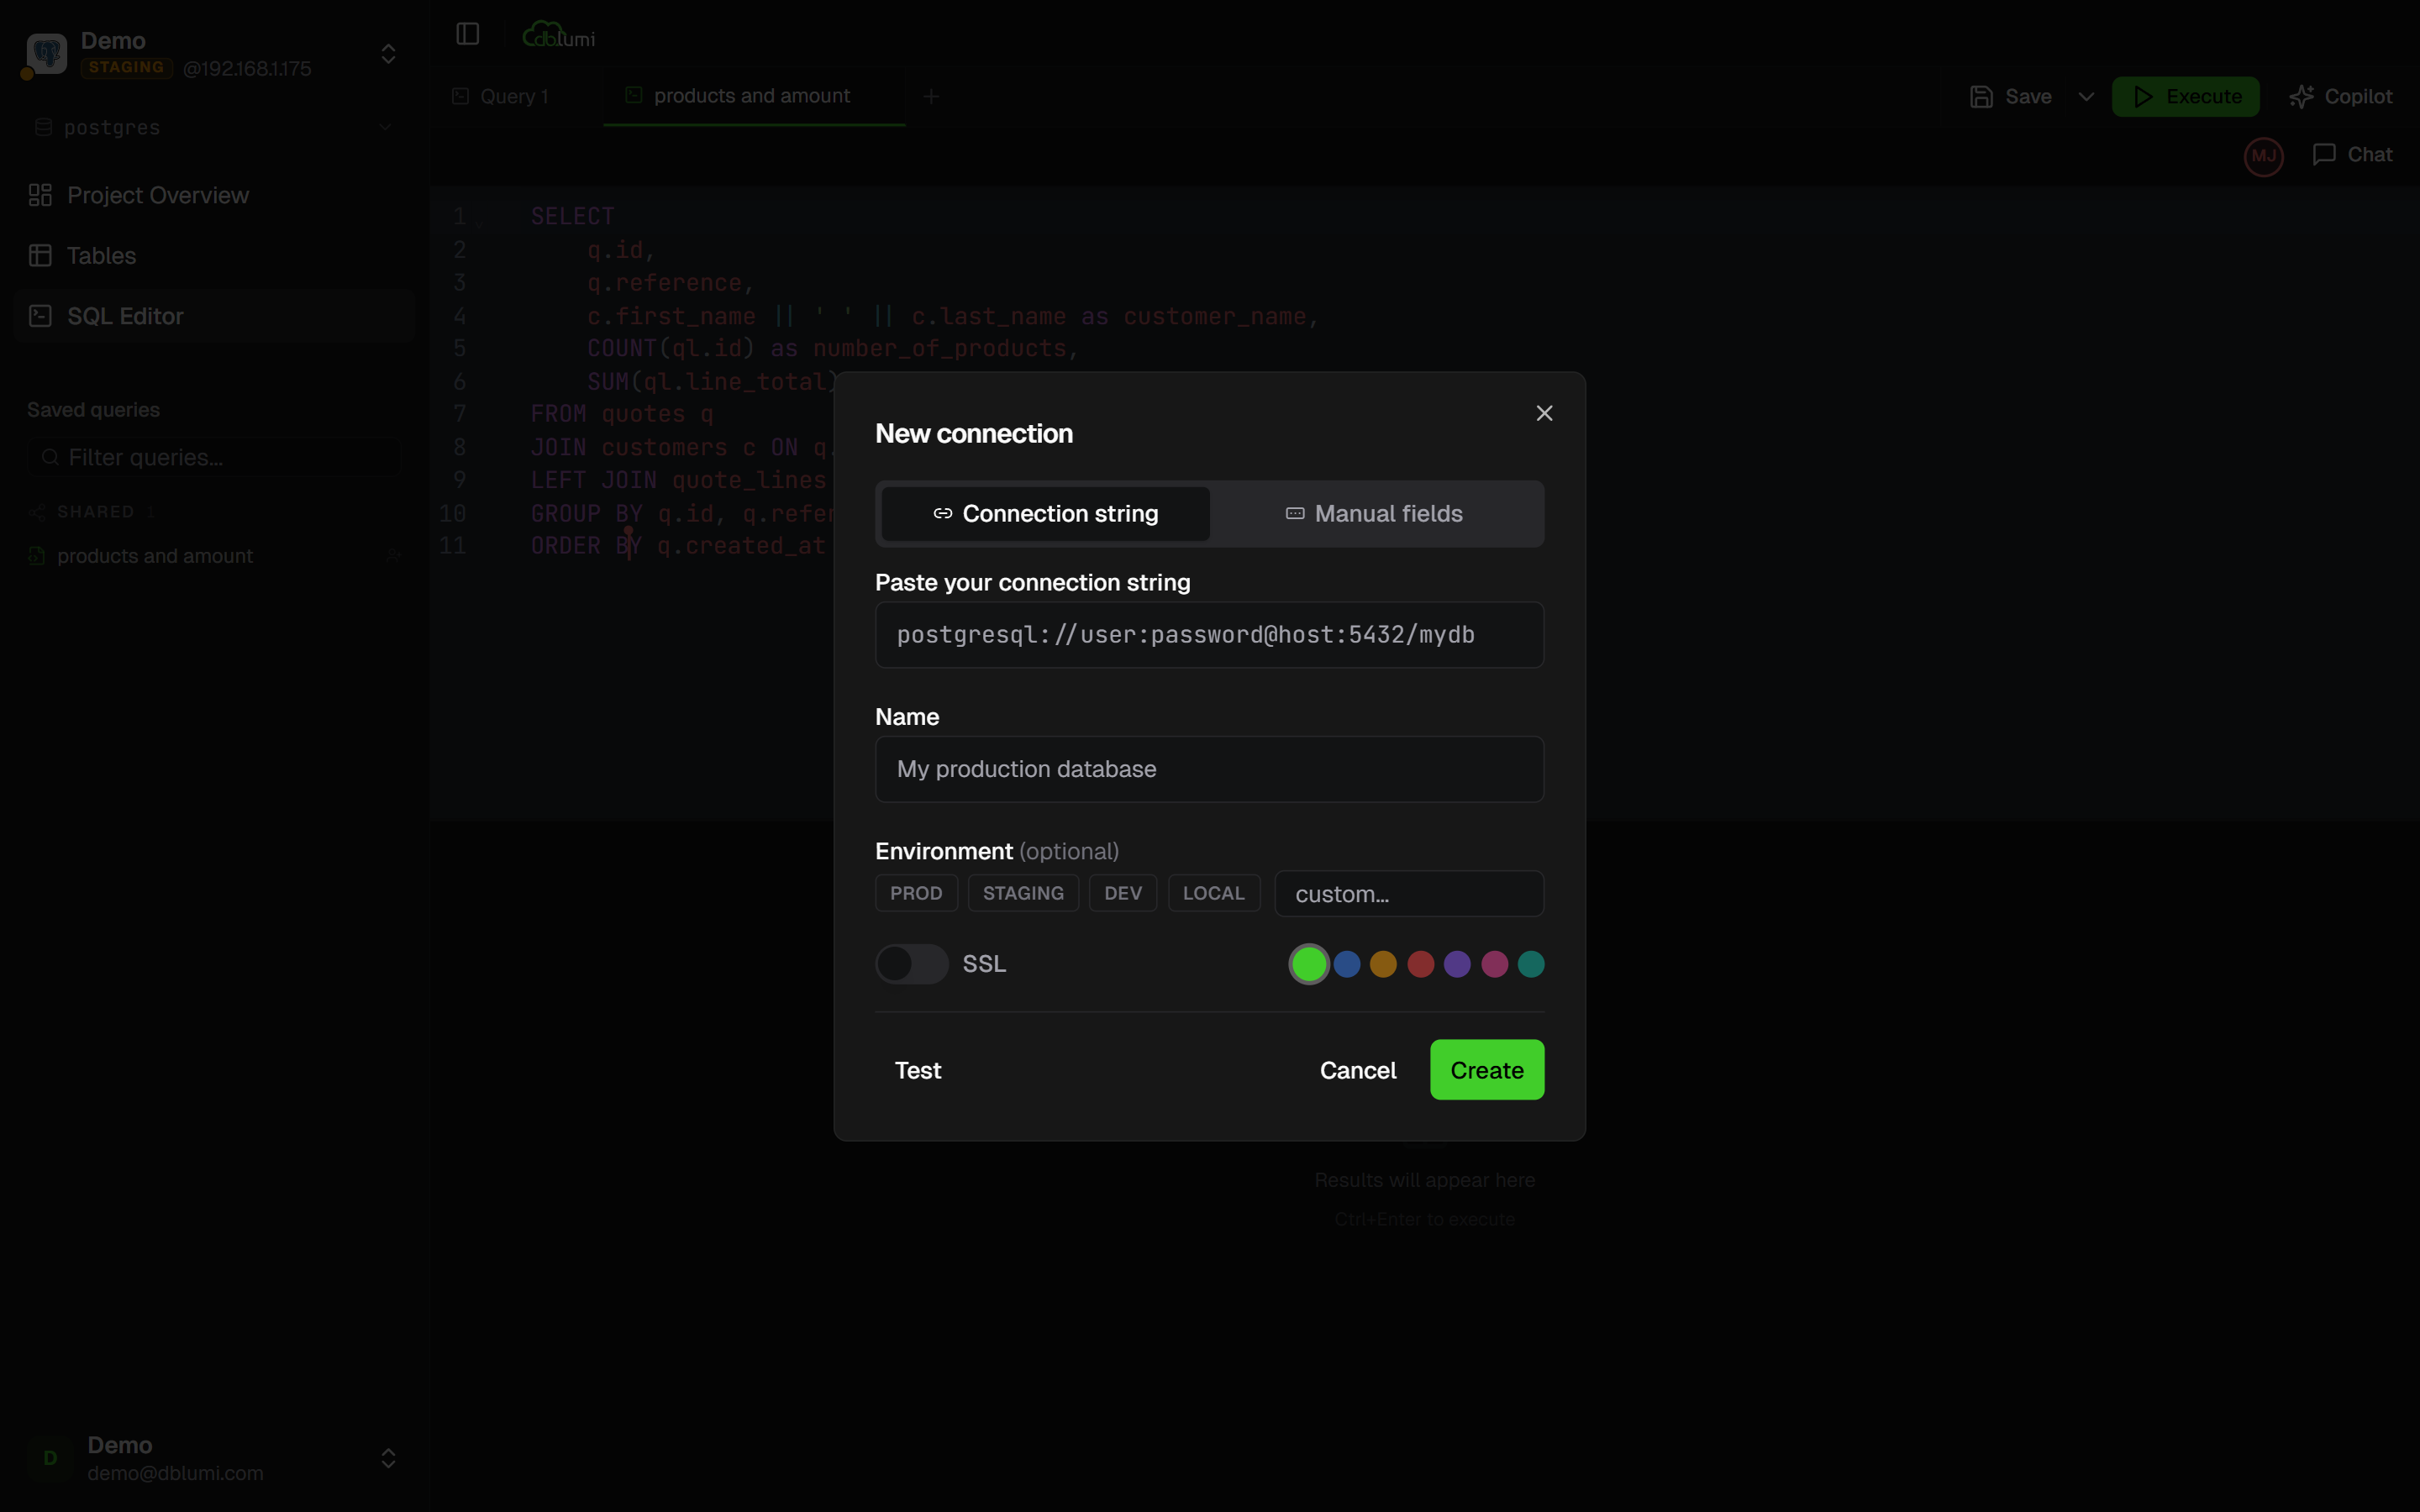
Add a connection
Section titled “Add a connection”- Click New connection in the sidebar
- Select your database driver: PostgreSQL, MySQL, Oracle, SQL Server, SQLite, Trino, Snowflake, MongoDB, or Redis
- Fill in the connection details: host, port, database name, username, password
- Tag the environment:
prod,staging,dev, orlocal - Click Test connection to verify, then Save
For Trino, the default port is 8080 and the database field holds the target: hive for a catalog, hive/default for a catalog and a schema.
The password is optional on Trino — leave it empty for a cluster without authentication. Database user management and data import/sync are not available on Trino connections.
For MongoDB, the default port is 27017 and the database defaults to test. The host field also accepts a full URI — paste your Atlas string (mongodb+srv://user:pass@cluster0.example.net/shop) in the connection string tab: the username and password are moved to their own fields and stored encrypted, and options such as authSource or replicaSet are kept. Username and password are optional for a server without authentication.
Queries use the mongosh syntax, one command per statement:
db.orders.find({ total: { $gt: 100 } }).sort({ at: -1 })db.orders.aggregate([{ $group: { _id: "$customer", revenue: { $sum: "$total" } } }])db.getCollection("2024-archive").countDocuments({})Commands are parsed, never evaluated: variables, functions and use are not supported (switch databases with the database selector). Writes go through the same guardrails as SQL — deleteMany({}) or drop() ask for confirmation. The structure editor, database users and data sync are not available on MongoDB; CSV import creates documents in a collection.
For SQL Server, the default port is 1433. To reach a named instance, write it in the host field (db-server\SQLEXPRESS): the port is then resolved by the SQL Browser service. Turn on SSL for Azure SQL. Scripts may use GO to separate batches: a batch that declares variables (DECLARE @n) or creates a procedure, function, trigger or view runs as one unit, the others are split into one result tab per statement. Each script runs on a session of its own, so USE, SET, temporary tables and transactions (BEGIN TRAN … ROLLBACK) behave as in SSMS without affecting other users. T-SQL has no EXPLAIN: the explain button is hidden.
For Snowflake, the host field holds the account identifier (myorg-myaccount, or the full https://….snowflakecomputing.com URL) — there is no port. The database field takes ANALYTICS or ANALYTICS/PUBLIC to pin a schema; the warehouse and role are optional. The password field accepts either a password or a PEM private key (-----BEGIN PRIVATE KEY-----…) for key-pair authentication, which service users need. Browsing the schema uses SHOW commands and does not wake up the warehouse; the total row count of a result comes from Snowflake itself, so no second query is spent on counting.
For Redis, the default port is 6379 and the database field is the database index (0 by default). The host field also accepts a redis://user:pass@host:6379/0 URL (rediss:// for TLS). Username and password are optional. Commands use the redis-cli syntax, one per line:
SCAN 0 MATCH user:* COUNT 1000HGETALL user:42SET session:abc "some value" EX 3600Redis has no tables: the schema browser lists key prefixes (user:*, session:*), and opening one shows a row per key with its type, TTL, size and — for strings — its value. In that grid you can rename a key, change its TTL, edit a string value, insert string keys and delete keys. FLUSHDB, FLUSHALL and administration commands ask for confirmation; KEYS warns that it blocks the server. SUBSCRIBE and MONITOR are not supported (they stream forever); MULTI … EXEC, SELECT and blocking commands such as BLPOP run on a connection of their own.
Connection visibility
Section titled “Connection visibility”By default, a connection is private — only you can see it. You can share it with specific users or groups from the connection settings.
You’re ready
Section titled “You’re ready”Once connected, you land on the Overview page — your dashboard for this database. From there you can open the SQL editor, browse your schema, or jump to a saved query.